
DevOps 和 SRE 团队正在改变软件开发的流程。 DevOps 工程师专注于高效的软件应用程序和服务交付,而 SRE 团队是确保可靠性、可扩展性和性能的关键。 这些团队必须依赖全栈可观察性解决方案,使他们能够管理和监控系统,并确保问题在影响业务之前得到解决。
整个现代分布式应用程序堆栈的可观察性需要通常以仪表板的形式收集、处理和关联数据。 摄取所有系统数据需要跨堆栈、框架和提供程序安装代理,对于必须处理版本更改、兼容性问题和不随系统更改而扩展的专有代码的团队来说,这个过程可能具有挑战性且耗时。
得益于 OpenTelemetry (OTel),DevOps 和 SRE 团队现在拥有一种标准方法来收集和发送数据,该方法不依赖于专有代码,并且拥有大型社区支持,减少了供应商锁定。
在这篇博文中,我们将向你展示如何使用 OpenTelemetry 手动检测 Go 应用程序。 这种方法比使用自动检测稍微复杂一些
在之前的博客中,我们还回顾了如何使用 OpenTelemetry 演示并将其连接到 Elastic®,以及 Elastic 与 OpenTelemetry 的一些功能。 在本博客中,我们将使用另一个演示应用程序,它有助于以简单的方式突出显示手动检测。
最后,我们将讨论 Elastic 如何支持与 Elastic 和 OpenTelemetry 代理一起运行的混合模式应用程序。 这样做的好处是不需要 otel-collector! 此设置你你能够根据最适合你业务的时间表,缓慢而轻松地将应用程序迁移到使用 Elastic 的 OTel。
应用程序、先决条件和配置
我们在这个博客中使用的应用程序称为 Elastiflix,一个电影流应用程序。 它由多个用 .NET、NodeJS、Go 和 Python 编写的微服务组成。
在我们检测示例应用程序之前,我们首先需要了解 Elastic 如何接收遥测数据。
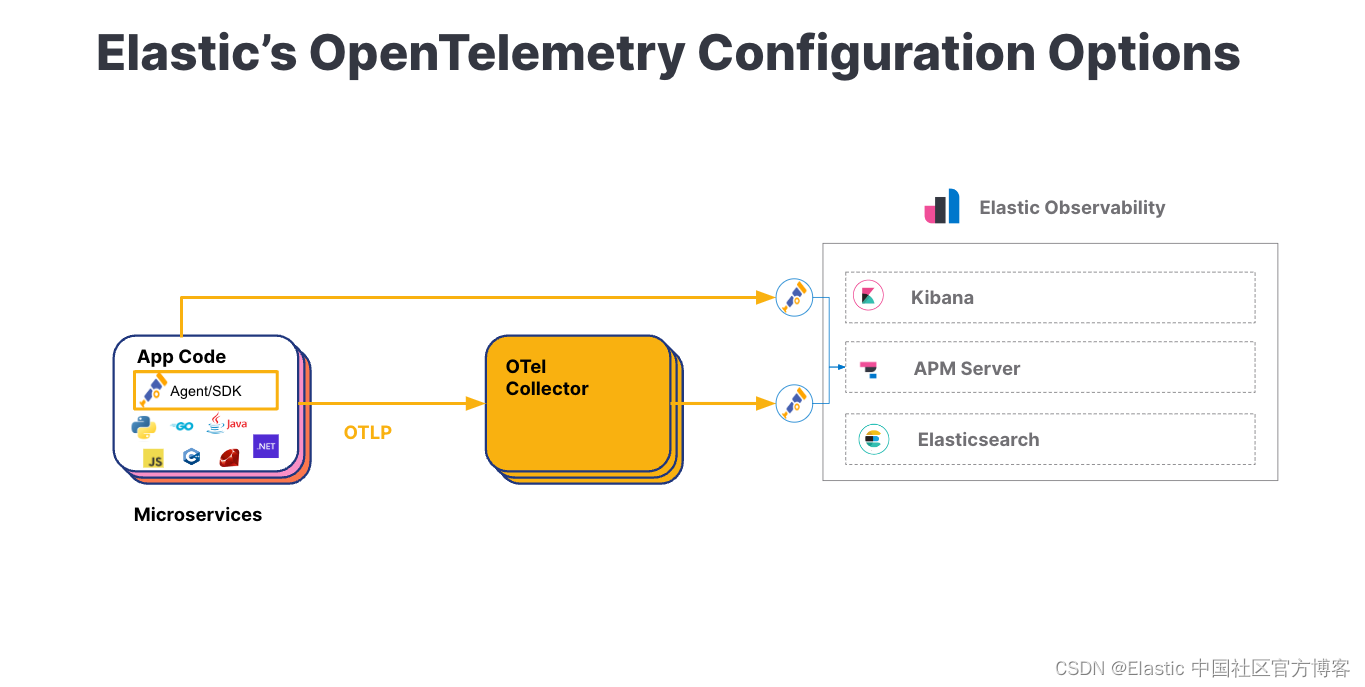
Elastic Observability 的所有 APM 功能均可通过 OTel 数据使用。 其中一些包括:
- Service maps
- 服务详细信息(延迟、吞吐量、失败的 transactions)
- 服务之间的依赖关系、分布式追踪
- transactions(跟踪)
- 机器学习 (ML) 相关性
- Log 相关性
除了 Elastic 的 APM 和遥测数据的统一视图之外,你还可以使用 Elastic 强大的机器学习功能来减少分析,并发出警报以帮助降低 MTTR。
先决条件
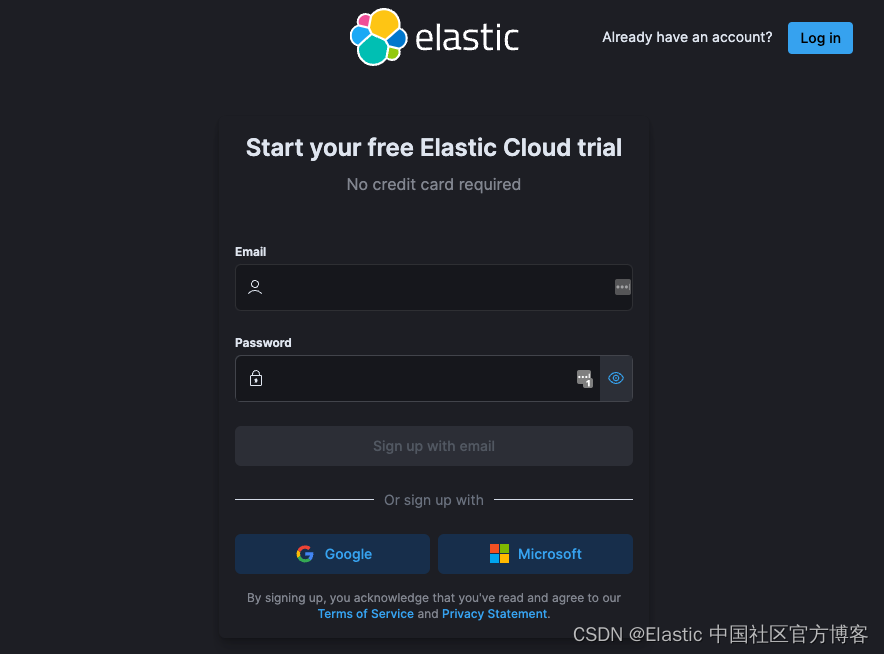
- Elastic Cloud 帐户 — 立即注册
- 克隆 Elastiflix 演示应用程序,或你自己的 Go 应用程序
- 对 Docker 的基本了解 — 可能安装 Docker Desktop
- 对 Go 的基本了解
查看示例源代码
完整的源代码(包括本博客中使用的 Dockerfile)可以在 GitHub 上找到。 该存储库还包含相同的应用程序,但没有检测。 这使你可以比较每个文件并查看差异。
在开始之前,让我们先看一下未检测的代码。
这是我们可以接收 GET 请求的简单 go 应用程序。 请注意,此处显示的代码是稍微缩写的版本。
package main

import (
	"log"
	"net/http"
	"os"
	"time"

	"github.com/go-redis/redis/v8"

	"github.com/sirupsen/logrus"

	"github.com/gin-gonic/gin"
	"strconv"
	"math/rand"
)

var logger = &logrus.Logger{
	Out:   os.Stderr,
	Hooks: make(logrus.LevelHooks),
	Level: logrus.InfoLevel,
	Formatter: &logrus.JSONFormatter{
		FieldMap: logrus.FieldMap{
			logrus.FieldKeyTime:  "@timestamp",
			logrus.FieldKeyLevel: "log.level",
			logrus.FieldKeyMsg:   "message",
			logrus.FieldKeyFunc:  "function.name", // non-ECS
		},
		TimestampFormat: time.RFC3339Nano,
	},
}

func main() {
	delayTime, _ := strconv.Atoi(os.Getenv("TOGGLE_SERVICE_DELAY"))

	redisHost := os.Getenv("REDIS_HOST")
	if redisHost == "" {
		redisHost = "localhost"
	}

	redisPort := os.Getenv("REDIS_PORT")
	if redisPort == "" {
		redisPort = "6379"
	}

	applicationPort := os.Getenv("APPLICATION_PORT")
	if applicationPort == "" {
		applicationPort = "5000"
	}

	// Initialize Redis client
	rdb := redis.NewClient(&redis.Options{
		Addr:     redisHost + ":" + redisPort,
		Password: "",
		DB:       0,
	})

	// Initialize router
	r := gin.New()
	r.Use(logrusMiddleware)

	r.GET("/favorites", func(c *gin.Context) {
		// artificial sleep for delayTime
		time.Sleep(time.Duration(delayTime) * time.Millisecond)

		userID := c.Query("user_id")

		contextLogger(c).Infof("Getting favorites for user %q", userID)

		favorites, err := rdb.SMembers(c.Request.Context(), userID).Result()
		if err != nil {
			contextLogger(c).Error("Failed to get favorites for user %q", userID)
			c.String(http.StatusInternalServerError, "Failed to get favorites")
			return
		}

		contextLogger(c).Infof("User %q has favorites %q", userID, favorites)

		c.JSON(http.StatusOK, gin.H{
			"favorites": favorites,
		})
	})

	// Start server
	logger.Infof("App startup")
	log.Fatal(http.ListenAndServe(":"+applicationPort, r))
	logger.Infof("App stopped")
}
分步指南
步骤 0. 登录你的 Elastic Cloud 帐户
本博客假设你有 Elastic Cloud 帐户 - 如果没有,请按照说明开始使用 Elastic Cloud。
步骤 1. 安装并初始化 OpenTelemetry
第一步,我们需要向应用程序添加一些额外的包。
import (
      "github.com/go-redis/redis/extra/redisotel/v8"
      "go.opentelemetry.io/otel"
      "go.opentelemetry.io/otel/attribute"
      "go.opentelemetry.io/otel/exporters/otlp/otlptrace"
    "go.opentelemetry.io/otel/exporters/otlp/otlptrace/otlptracegrpc"

	"go.opentelemetry.io/otel/propagation"

	"google.golang.org/grpc/credentials"
	"crypto/tls"

      sdktrace "go.opentelemetry.io/otel/sdk/trace"

	"go.opentelemetry.io/contrib/instrumentation/github.com/gin-gonic/gin/otelgin"

	"go.opentelemetry.io/otel/trace"
	"go.opentelemetry.io/otel/codes"
)
此代码导入必要的 OpenTelemetry 包,包括用于跟踪、导出和检测特定库(如 Redis)的包。
接下来我们读取 OTEL_EXPORTER_OTLP_ENDPOINT 变量并初始化导出器。
var (
    collectorURL = os.Getenv("OTEL_EXPORTER_OTLP_ENDPOINT")
)
var tracer trace.Tracer


func initTracer() func(context.Context) error {
	tracer = otel.Tracer("go-favorite-otel-manual")

	// remove https:// from the collector URL if it exists
	collectorURL = strings.Replace(collectorURL, "https://", "", 1)
	secretToken := os.Getenv("ELASTIC_APM_SECRET_TOKEN")
	if secretToken == "" {
		log.Fatal("ELASTIC_APM_SECRET_TOKEN is required")
	}

	secureOption := otlptracegrpc.WithInsecure()
    exporter, err := otlptrace.New(
        context.Background(),
        otlptracegrpc.NewClient(
            secureOption,
            otlptracegrpc.WithEndpoint(collectorURL),
			otlptracegrpc.WithHeaders(map[string]string{
				"Authorization": "Bearer " + secretToken,
			}),
			otlptracegrpc.WithTLSCredentials(credentials.NewTLS(&tls.Config{})),
        ),
    )

    if err != nil {
        log.Fatal(err)
    }

    otel.SetTracerProvider(
        sdktrace.NewTracerProvider(
            sdktrace.WithSampler(sdktrace.AlwaysSample()),
            sdktrace.WithBatcher(exporter),
        ),
    )
	otel.SetTextMapPropagator(
		propagation.NewCompositeTextMapPropagator(
			propagation.Baggage{},
			propagation.TraceContext{},
		),
	)
    return exporter.Shutdown
}
为了检测到 Redis 的连接,我们将向其添加一个跟踪钩子(hook),为了检测 Gin,我们将添加 OTel 中间件。 这将自动捕获与我们的应用程序的所有交互,因为 Gin 将被完全检测。 此外,所有到 Redis 的传出连接也将被检测。
      // Initialize Redis client
	rdb := redis.NewClient(&redis.Options{
		Addr:     redisHost + ":" + redisPort,
		Password: "",
		DB:       0,
	})
	rdb.AddHook(redisotel.NewTracingHook())
	// Initialize router
	r := gin.New()
	r.Use(logrusMiddleware)
	r.Use(otelgin.Middleware("go-favorite-otel-manual"))
添加自定义 span
现在我们已经添加并初始化了所有内容,我们可以添加自定义跨度。
如果我们想为应用程序的一部分提供额外的检测,我们只需启动一个自定义 span,然后推迟结束该 span。
// start otel span
ctx := c.Request.Context()
ctx, span := tracer.Start(ctx, "add_favorite_movies")
defer span.End()
为了进行比较,这是我们示例应用程序的检测代码。 你可以在 GitHub 上找到完整的源代码。
package main

import (
	"log"
	"net/http"
	"os"
	"time"
	"context"

	"github.com/go-redis/redis/v8"
	"github.com/go-redis/redis/extra/redisotel/v8"


	"github.com/sirupsen/logrus"

	"github.com/gin-gonic/gin"

  "go.opentelemetry.io/otel"
  "go.opentelemetry.io/otel/attribute"
  "go.opentelemetry.io/otel/exporters/otlp/otlptrace"
  "go.opentelemetry.io/otel/exporters/otlp/otlptrace/otlptracegrpc"

	"go.opentelemetry.io/otel/propagation"

	"google.golang.org/grpc/credentials"
	"crypto/tls"

  sdktrace "go.opentelemetry.io/otel/sdk/trace"

	"go.opentelemetry.io/contrib/instrumentation/github.com/gin-gonic/gin/otelgin"

	"go.opentelemetry.io/otel/trace"

	"strings"
	"strconv"
	"math/rand"
	"go.opentelemetry.io/otel/codes"

)

var tracer trace.Tracer

func initTracer() func(context.Context) error {
	tracer = otel.Tracer("go-favorite-otel-manual")

	collectorURL = strings.Replace(collectorURL, "https://", "", 1)

	secureOption := otlptracegrpc.WithInsecure()

	// split otlpHeaders by comma and convert to map
	headers := make(map[string]string)
	for _, header := range strings.Split(otlpHeaders, ",") {
		headerParts := strings.Split(header, "=")

		if len(headerParts) == 2 {
			headers[headerParts[0]] = headerParts[1]
		}
	}

    exporter, err := otlptrace.New(
        context.Background(),
        otlptracegrpc.NewClient(
            secureOption,
            otlptracegrpc.WithEndpoint(collectorURL),
			otlptracegrpc.WithHeaders(headers),
			otlptracegrpc.WithTLSCredentials(credentials.NewTLS(&tls.Config{})),
        ),
    )

    if err != nil {
        log.Fatal(err)
    }

    otel.SetTracerProvider(
        sdktrace.NewTracerProvider(
            sdktrace.WithSampler(sdktrace.AlwaysSample()),
            sdktrace.WithBatcher(exporter),
            //sdktrace.WithResource(resources),
        ),
    )
	otel.SetTextMapPropagator(
		propagation.NewCompositeTextMapPropagator(
			propagation.Baggage{},
			propagation.TraceContext{},
		),
	)
    return exporter.Shutdown
}

var (
  collectorURL = os.Getenv("OTEL_EXPORTER_OTLP_ENDPOINT")
	otlpHeaders = os.Getenv("OTEL_EXPORTER_OTLP_HEADERS")
)


var logger = &logrus.Logger{
	Out:   os.Stderr,
	Hooks: make(logrus.LevelHooks),
	Level: logrus.InfoLevel,
	Formatter: &logrus.JSONFormatter{
		FieldMap: logrus.FieldMap{
			logrus.FieldKeyTime:  "@timestamp",
			logrus.FieldKeyLevel: "log.level",
			logrus.FieldKeyMsg:   "message",
			logrus.FieldKeyFunc:  "function.name", // non-ECS
		},
		TimestampFormat: time.RFC3339Nano,
	},
}

func main() {
	cleanup := initTracer()
  defer cleanup(context.Background())

	redisHost := os.Getenv("REDIS_HOST")
	if redisHost == "" {
		redisHost = "localhost"
	}

	redisPort := os.Getenv("REDIS_PORT")
	if redisPort == "" {
		redisPort = "6379"
	}

	applicationPort := os.Getenv("APPLICATION_PORT")
	if applicationPort == "" {
		applicationPort = "5000"
	}

	// Initialize Redis client
	rdb := redis.NewClient(&redis.Options{
		Addr:     redisHost + ":" + redisPort,
		Password: "",
		DB:       0,
	})
	rdb.AddHook(redisotel.NewTracingHook())


	// Initialize router
	r := gin.New()
	r.Use(logrusMiddleware)
	r.Use(otelgin.Middleware("go-favorite-otel-manual"))


	// Define routes
	r.GET("/", func(c *gin.Context) {
		contextLogger(c).Infof("Main request successful")
		c.String(http.StatusOK, "Hello World!")
	})

	r.GET("/favorites", func(c *gin.Context) {
		// artificial sleep for delayTime
		time.Sleep(time.Duration(delayTime) * time.Millisecond)

		userID := c.Query("user_id")

		contextLogger(c).Infof("Getting favorites for user %q", userID)

		favorites, err := rdb.SMembers(c.Request.Context(), userID).Result()
		if err != nil {
			contextLogger(c).Error("Failed to get favorites for user %q", userID)
			c.String(http.StatusInternalServerError, "Failed to get favorites")
			return
		}

		contextLogger(c).Infof("User %q has favorites %q", userID, favorites)

		c.JSON(http.StatusOK, gin.H{
			"favorites": favorites,
		})
	})

	// Start server
	logger.Infof("App startup")
	log.Fatal(http.ListenAndServe(":"+applicationPort, r))
	logger.Infof("App stopped")
}
步骤 2. 使用环境变量运行 Docker 镜像
正如 OTEL 文档中所指定的,我们将使用环境变量并传入 APM 代理配置部分中找到的配置值。
由于 Elastic 本身接受 OTLP,因此我们只需要提供 OTEL Exporter 需要发送数据的端点和身份验证,以及一些其他环境变量。
在 Elastic Cloud 和 Kibana® 中从哪里获取这些变量
你可以从路径 /app/home#/tutorial/apm 下的 Kibana 复制端点和 token。
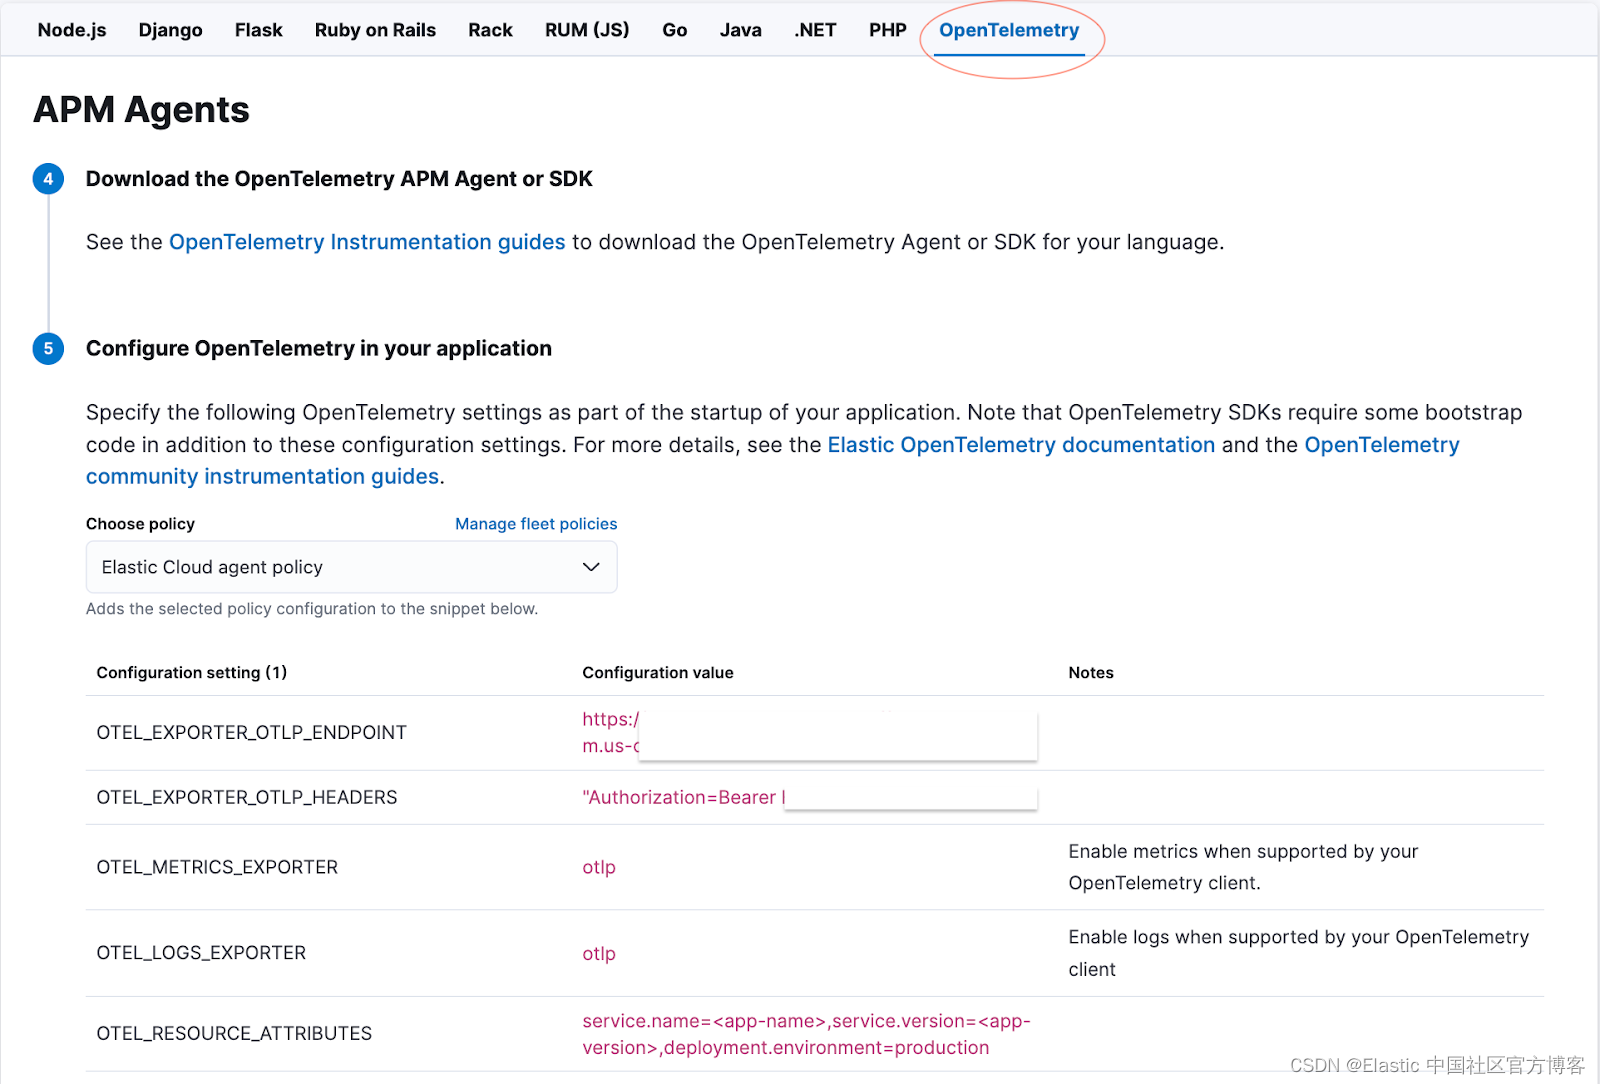
你需要复制 OTEL_EXPORTER_OTLP_ENDPOINT 以及 OTEL_EXPORTER_OTLP_HEADERS。
构建镜像
docker build -t go-otel-manual-image .运行镜像
docker run \
       -e OTEL_EXPORTER_OTLP_ENDPOINT="<REPLACE WITH OTEL_EXPORTER_OTLP_ENDPOINT>" \
       -e OTEL_EXPORTER_OTLP_HEADERS="Authorization=Bearer <REPLACE WITH TOKEN>" \
       -e OTEL_RESOURCE_ATTRIBUTES="service.version=1.0,deployment.environment=production,service.name=go-favorite-otel-manual" \
       -p 5000:5000 \
       go-otel-manual-image
你现在可以发出一些请求来生成跟踪数据。 请注意,这些请求预计会返回错误,因为此服务依赖于你当前未运行的 Redis 连接。 如前所述,你可以在此处找到使用 Docker compose 的更完整示例。
curl localhost:500/favorites
# or alternatively issue a request every second
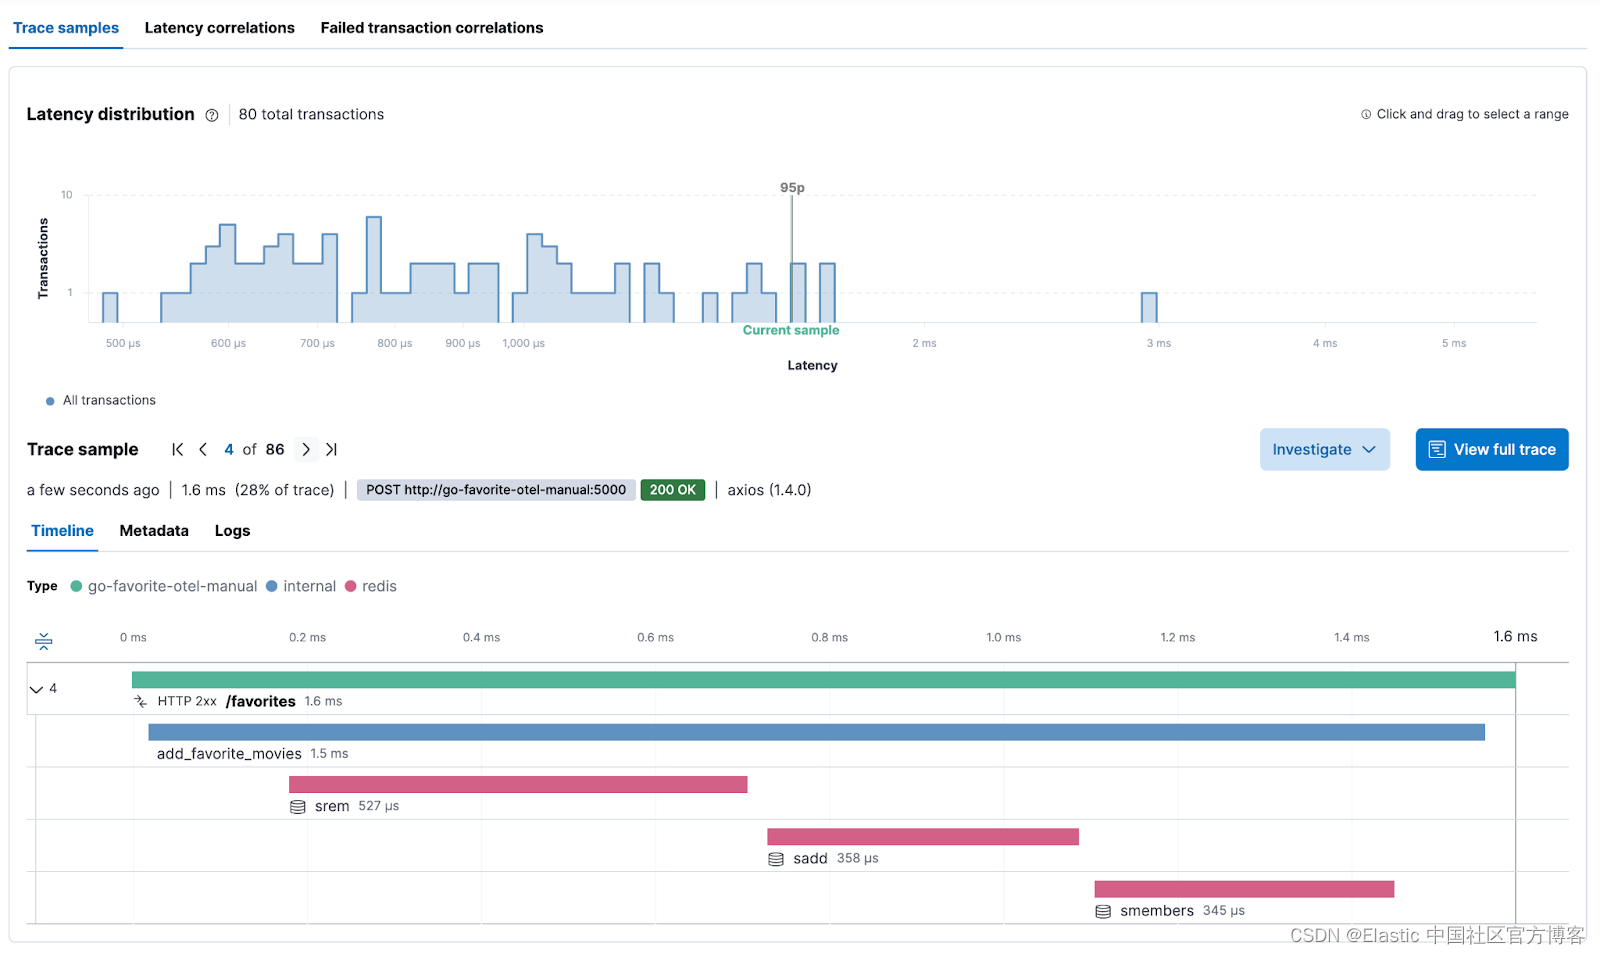
while true; do curl "localhost:5000/favorites"; sleep 1; done;跟踪如何显示在 Elastic 中?
现在该服务已完成检测,在查看 Node.js 服务的 transaction 部分时,你应该会在 Elastic APM 中看到以下输出:
结论
在这篇博客中,我们讨论了以下内容:
- 如何使用 OpenTelemetry 手动检测 Go
- 如何正确初始化 OpenTelemetry 并添加自定义范围
- 如何使用 Elastic 轻松设置 OTLP ENDPOINT 和 OTLP HEADERS,而不需要收集器
希望它能够提供一个易于理解的使用 OpenTelemetry 检测 Go 的演练,以及将跟踪发送到 Elastic 是多么容易。
有关 OpenTelemetry with Elastic 的其他资源:
开发者资源:
- Elastiflix application, a guide to instrument different languages with OpenTelemetry
- Python: Auto-instrumentation, Manual-instrumentation
- Java: Auto-instrumentation, Manual-instrumentation
- Node.js: Auto-instrumentation, Manual-instrumentation
- .NET: Auto-instrumentation, Manual-instrumentation
- Go: Manual-instrumentation
- Best practices for instrumenting OpenTelemetry
常规配置和用例资源:
- Independence with OpenTelemetry on Elastic
- Modern observability and security on Kubernetes with Elastic and OpenTelemetry
- 3 models for logging with OpenTelemetry and Elastic
- Adding free and open Elastic APM as part of your Elastic Observability deployment
- Capturing custom metrics through OpenTelemetry API in code with Elastic
- Future-proof your observability platform with OpenTelemetry and Elastic
- Elastic Observability: Built for open technologies like Kubernetes, OpenTelemetry, Prometheus, Istio, and more
原文:Manual instrumentation of Go applications with OpenTelemetry | Elastic Blog


